I usually don't like to pine about stocks that I have been watching but haven't invested in "jumping" but this one stings. I had planned on buying RAND Capital (RAND) this coming Monday when today it jumps 27%. The problem is I am an access person at the firm I work at and cannot purchase any security which hasn't been precleared before hand. They only preclear on Mondays so I have to wait until Monday before I could purchase RAND.
Overall, the portfolio had an excellent day handily outperforming the indexes. The portfolio gained 0.64% (+1,498.74) beating the S&P500 (0.08%) and Russell 2000 (0.25%). Strong showings from TOA, MRVC, and BUD boosted the portfolio. EWEB and GYI were the detractors.
Thursday, November 30, 2006
Wednesday, November 29, 2006
Movin up...
The portfolio moved up nearly a percentage point (0.98% +2,367.71) today outperforming all major indexes except the Russell 2000 which was up 1.21%. The only detractors were EWEB which continued its migration downward after yesterdays spike and Anheuser-Busch which dropped 0.58%.
My individual securities performed better than my mutual funds. Genentech moved nicely higher after trailing down over the past week. Coach performed well again gaining another 2.56%. I sold another $10,000 out of Wasatch Core growth to prepare for some more micro cap purchases either tomorrow or next week.
My individual securities performed better than my mutual funds. Genentech moved nicely higher after trailing down over the past week. Coach performed well again gaining another 2.56%. I sold another $10,000 out of Wasatch Core growth to prepare for some more micro cap purchases either tomorrow or next week.
Tuesday, November 28, 2006
EWEB and MHJ Boost
Just hours after I purchased 950 shares of EWEB at 2.08, the stock jumped more than 11% on no news. It looks as if a large market order was entered this morning that punched through several layers of limit sell orders up to $2.76 at one point. Then some profit taking took place and the stock slowly retreated down to $2.31.
This morning around 9am, I entered a limit order for Man Sang Holdings (MHJ) for 400 shares at $4.51. I checked around lunchtime and found that my order had been filled and that also the stock was up almost 12% before settling near 4.94. Still a nice 10% gain in only a few hours.
Overall the portfolio performed well gaining 0.37% ($920.14) outperforming the S&P500 and the Russell 1000.
Monday, November 27, 2006
Wal-Mart Dissapoints
Wal-Mart same store sales dropped a meager 0.1% this past quarter. However, that was the first time in 10 years that this occurred and is signalling to Wall St that the retail season is off to a slow start. That news sent stocks reeling with its worst one day drop in four months. The Dow fell 158 points, S&P was down 19 (1.36%). The Russell 2000 index was down a whopping 2.55%. Decliners led Advancers by a hefty 4-1 margin.
The dollar also continues to get punished and is now down to 20-month lows against the Euro at 1.3133 showing signs that foreign investors are sensing a slowdown in the US market and have started searching for opportunities abroad.
Retailers felt the most pain today based on Wal-Marts numbers. J Crew fell over 7% based on an analyst downgrade. However, that downgrade was based on the recent runnup and not on slow sales.
I wonder if the market has overblown the numbers released by Wal-Mart. Many retailers are reporting heavy traffic into their stores this past weekend. Now I realize that foot traffic does not always mean more sales, but there is a correlation. I expect that sales will be in line with forecasts and that the markets will recover from today's sell-off.
Two new positions to report. The first is MRV Communications- (MRVC). They design, manufacture and sell communication equipment and services. They have two division, networking (basically a small CISCO) and an optical components group. The company is just becoming profitable and is trading at a forward P/E of 33. The stock has jumped 85% in the past year which would normally knock this stock off my radar but with the prospects and fundamentals still ripe, I think its got some more upside movement to go.
It is trading at 2 times book value and has enough cash to cover debt three times over. Institutional buying has pushed Inst. ownership over 40% and I believe it will continue to rise pushing up the stock price.
The other position is EuroWeb International (EWEB). This is basically a liquidation, buyout and net-net play. It is trading around $2 a share, about have liquidation value. The CEO recently resigned and the company is basically switching its business model completely. We'll see how this new management team works out. In the meantime, they have been buying back stock and with 78% owned by insiders, is an excellant "going private" play. There are risks that the management team will simply soak up the cash but those are relatively low.
Recently they have gotten into Real Estate with 5 projects on the books. A couple of the projects are in Nevada- one such project is developing 296 condos in the Las Vegas area. This worries me since real estate in Las Vegas has been plummeting- one of the hardest hit markets in the country. Others are smaller projects such as a single family residence as well as 2 multi-family residences in the LA area. Ill keep you posted on what they get into next.
The portfolio was down 1.41% ($3,456.80), one of my worst days ever. Only the Dow Jones and S&P500 fared better, but only slightly.
Friday, November 24, 2006
Weekly Summary
For the week, the portfolio gained a respectable 0.59% ($1,423.14) outperforming the S&P 500 and Russell 1000 indexes. My stock picks did not perform as well as my mutual funds which were helped by rising energy prices- Fidelity Energy and Fidelity Leveraged Company each returned over 1.2% for the week. These portfolio's weathered the oil price drop fairly well.
Coach continues to climb with every news release toting luxury goods during the holiday season. Bud and Genentech are trading sideways. Bud isn't going to spike anytime soon but I feel as they expand their offering of products outside of alcoholic beverages, more institutional buying will take place pushing the stock up to possibly $60. Genentech is a great cancer drug play. I feel this stock will increase by 20% a year for the next 3 years.
I plan on making several micro cap purchases next week. Ill disclose those upon purchasing them. Overall, I'm happy with the performance of the portfolio and it beat my goal of .50% gain per week.
Tuesday, November 21, 2006
The Lack of Value Stocks
Today I had time to run some of my favorite stock screens. I have noticed a steep decline in the number of opportunities currently in the market. The same crap comes up time after time. Looking back, I wish we were back in early '03. Oh well, guess I'll have to make do with the market we got.
In the meantime, there are a couple of stocks that I have been watching approaching levels where I would consider putting in some seed money. One stock I am looking at is trading at 5.12 trailing earnings, P/B of 0.93, a price of $6.10 but a book per share of $6.80, ROE of 22%, and 0.6 P/S. The drawback is the high debt, with over $300 million in debt and just $85m in cash, the stock is a little risky. I'm going to do more analysis this holiday break and let you know.
Coach was up another 1% today on strong volume. I'm wondering if its going to be another Amazon where you see this pop from Thanksgiving to New Years for the holidays and then struggle in January. I dont think it will and I believe I'll hold it.
Getty Images is up .77% today. This position has been moving slowly but steadily upward since Sept. as it got pounded this past summer on slowing growth prospects.
Overall, the portfolio did decently gaining 0.35% ($839.85) versus 0.20% for the Russell 1000 and 0.16% for the S&P 500.
Monday, November 20, 2006
Blah day..
GYI is up nicely since i bought it a few weeks ago. Overall though, the portfolio didnt fair very well, down 0.17% (down $422.15). The Russell 1000 growth lost 0.3%, thus i underperformed. I am still in the process of transforming my portfolio. My goal is to have several large cap companies that I can accurately predict future cash flows and believe are undervalued. Small caps is where I will focus the bulk of my attention hoping to isolate and identify securities that are mispriced.
Disclaimer
Important Disclaimer - Don't buy any of the stocks I buy, without doing your own due diligence and satisfying yourself that these are investments you want to own, without any reliance on any information contained in this blog.
Here's why:
This blog is for my own purpose, not to disseminate stock picks. Please do not mimick my decisions unless you conduct you own research first.
I don't do overly extensive due diligence on the stocks that I own. I don't have the time nor the energy to vigorously research each company. Typically, I look at a company's financial statements, key statistics and some news items about the company that I can find.
I am not responsible for misrepresented posts, any information I post incorrectly, or any typos that cause errors on my part or yours.
I use this blog as a personal journal where I can keep track of my investments and hopefully, teach people something along the way. However, more likely than not, it is you who will teach my something.
I won't tell you when I am about to buy or sell a stock. If I did, the extra competition for my order would reduce my profits. I don't want that.
Some stocks I own are especially volatile. Some of my investments are in microcap stocks with little or no analyst following. These stock are prone to wild swings in prices and often have huge ask/bid spreads. Without even considering other valuation issues, selling or buying on the wrong side of the bid/ask at the wrong time, can result in large losses, sometimes doing serious damage to your portfolio.
Just because I own a stock does not mean I would buy it now. Some of the stocks that I may own may have significantly increased in price since I bought them. Hence, their potential for further returns may be limited. Alternatively, the good situation I thought I saw when buying may have deteriorated, or I may have mis-analyzed the situation, and I might just be trying to ride it out.
I may still talk positively about companies whose stock I'm in the process of selling. I try not to confuse the company with the value of its stock. Great companies (that includes great microcap companies too), can become too overpriced but that doesn't mean I don't still think they're great companies (even if over-priced). Alternatively, they may have reached a quantity in my portfolio that I'm no longer comfortable with, and am in the process of re-balancing.
Even doing exactly as I do (assuming you knew exactly what I was doing and when), your portfolio may still suffer large and serious losses.
Finally, you don't know me, or my motives. That should be reason enough.
Special thanks to StockCoach (Shadowtrader) and Small, Smaller, Smallest for the bulk of this disclaimer.
Sunday, November 19, 2006
Decent Week
Friday was a slightly down day (.14%) but for the week I was up 1.2% beating the S&P 500 (1.1%). I begin the week with $242,543.31 with just 2% in cash. I hope to reduce my mutual fund holdings after the new year (to avoid the tax liability) and hold more positions, especially smallcap and microcap stocks.
Thursday, November 16, 2006
Claymore Sabrient Stealth ETF

About 2 weeks ago I purchased the Claymore Sabrient Stealth Portfolio ETF. Profile is above. This ETF seeks to replicate the index- The Sabrient Stealth Index- with a correlation of 95% or better over time. The index is comprised of 150 stocks that have little or no analyst coverage by Wall St.
The ETF is based on a philosophy that under covered stocks represent a huge risk-return possibility. Basically, they look to profit from the next Wal-Mart or Microsoft that no analyst is covering, is receiving little press by the media, or is too small to be bought by most mutual funds.
The index is constructed from a universe of all U.S. equities and ADRs that have 2 or less analysts covering them. 150 of the highest ranking stocks are then chosen using a quantitative based approach that ranks the securities based on growth-oriented, multi-factor filters. The stocks are then given a modified equal weighting and the portfolio is then rebalanced once per quarter.
The returns are below.

The index is benchmarked to the Russell 2000 index, a broad, small cap index. Over 80% of the index has a market cap below $1 billion with 60% falling into micro-cap territory. This makes sense since most unercovered securities are small business with little or no earnings are very little revenue.
Conclusion: I bought the index in October at $26.25 a share. I think this is an excellant way to play the micro cap space if you dont have the time to investigate individual stocks. The average market cap is $768 million but the average P/E is 18.95, less than the S&P500. I think the ETF has excellant long-term potential.
Disclaimer: I am long shares of the Claymore Sabrient Stealth ETF
Wednesday, November 15, 2006
Case for Coach
Company: Coach Inc.
Ticker: COH
Market Cap: $15.4B
Shares Out: 367M
F P/E Ratio: 20.95
EPS: 1.37
Price: $38.61
Coach continues to drive ahead up over 3% today after a report released from Reuters last night and again this morning predicted very strong christmas sales this year. I wanted to purchase the stock in the mid 30's but it took too long to get 'approval' for it from my company. It can take upwards of a week to get approval from the investment staff. So, by the time I got approval, the earnings had been released and i could only get in at 38.41. With the stock up to 41.80, I have made a nice 8.8% in just a few weeks.
My analysis is based on the valuation model below. I forecast a slightly conservative 14% average revenue growth rate from 2008-2011, decreasing to 8% thereafter and a terminal growth of 3.5% Also, EBITA is conservative as well with the margin decreasing over 300 basis points over the course of 4 years.
I think this is extremely conservative givin the expansion opportunities and new products that will be coming out over the next few years. Operating profits have been growing at over 50% annually for the last 5 years- a streak unlikely to continue. However, I believe most analysts are underestimating their top line growth. Conceivably, I would imagine top line growth to average between 17-19% over the next 5 years.
Coach has had tremendous US growth over the past 5 years or so. However, the new growth driver will be Asia where they are broadening their presence in Japan and expanding into China. They plan on adding another 35 stores in the U.S. and between 15-20 in Japan, where they completed the purchase of Coach Japan last year. 20% of sales are being converted into free cash flow.
The firm does have its risks in that the high end retail market is extremely fickle and with new products coming onto the market each season, the chance that Coach will be out of style would have disastrous effects on the top line estimates.
My model gives the firm a $20B+ market cap giving an implied share price of $55.34; a 30.9% upside potential off the $42.30 quote as of 3:40pm today.
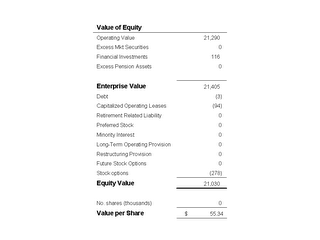
Below is a simple check model that i do after completing the more complex to make sure I'm not way off the mark. I use Thomson Baseline or First Call to find the estimated 5 year EPS growth rate average and enter it into the model along with the current years EPS. I then estimate the P/E 5 years from now either using the drivers above or historical industry P/Es. This give me an estimated stock price.


Disclaimer: I am currently long shares of Coach (Coh).
Ticker: COH
Market Cap: $15.4B
Shares Out: 367M
F P/E Ratio: 20.95
EPS: 1.37
Price: $38.61
Coach continues to drive ahead up over 3% today after a report released from Reuters last night and again this morning predicted very strong christmas sales this year. I wanted to purchase the stock in the mid 30's but it took too long to get 'approval' for it from my company. It can take upwards of a week to get approval from the investment staff. So, by the time I got approval, the earnings had been released and i could only get in at 38.41. With the stock up to 41.80, I have made a nice 8.8% in just a few weeks.
My analysis is based on the valuation model below. I forecast a slightly conservative 14% average revenue growth rate from 2008-2011, decreasing to 8% thereafter and a terminal growth of 3.5% Also, EBITA is conservative as well with the margin decreasing over 300 basis points over the course of 4 years.
I think this is extremely conservative givin the expansion opportunities and new products that will be coming out over the next few years. Operating profits have been growing at over 50% annually for the last 5 years- a streak unlikely to continue. However, I believe most analysts are underestimating their top line growth. Conceivably, I would imagine top line growth to average between 17-19% over the next 5 years.
Coach has had tremendous US growth over the past 5 years or so. However, the new growth driver will be Asia where they are broadening their presence in Japan and expanding into China. They plan on adding another 35 stores in the U.S. and between 15-20 in Japan, where they completed the purchase of Coach Japan last year. 20% of sales are being converted into free cash flow.
The firm does have its risks in that the high end retail market is extremely fickle and with new products coming onto the market each season, the chance that Coach will be out of style would have disastrous effects on the top line estimates.
My model gives the firm a $20B+ market cap giving an implied share price of $55.34; a 30.9% upside potential off the $42.30 quote as of 3:40pm today.
Below is a simple check model that i do after completing the more complex to make sure I'm not way off the mark. I use Thomson Baseline or First Call to find the estimated 5 year EPS growth rate average and enter it into the model along with the current years EPS. I then estimate the P/E 5 years from now either using the drivers above or historical industry P/Es. This give me an estimated stock price.
Disclaimer: I am currently long shares of Coach (Coh).
Tuesday, November 14, 2006
What to do?
Yesterday I sold my Fidelity Select Health Care fund and I'm unsure of what to do with the proceeds. With $5502 in cash, my overall position in cash is only 2.3%. At this point, it may be better to leave the proceeds as cash than to look for investment opportunities that might not be qualified for the money. With the market at all time highs, the capital may be of better use held in reserve to wait for more attractive buying opportunities.
Monday, November 13, 2006
Health Care Glut
Today I am selling out of one of the sector funds I currently own. The Fidelity Select Health Care has returned just 10% over the last 18 months and with the Democratic sweep of congress, I think HealthCare will only tread water at best.
Pharmas are going to be the main whipping post for the democrate in congress but with just a slim majority and President Bush still in the White House with his veto power, little action will be taken. Right now, Pharmas have experienced a downturn since last Tuesday. Wall St. is basically pricing in a slim chance of some pricing controls being passed. For now, the sectors outlook looks as bright as ever.
My position in Genentech will not be altered. At $81 a share, it is trading at 30x forward earnings; not cheap by any means but way off hisotorical P/e's. This might present a possible buying opportunity for additional shares for a company growing at a 20% rate.
Sunday, November 12, 2006
Current Portfolio
For my first post, I'll simply display my portfolio and some of my reasoning behind my holdings. Currently, I own 5 Fidelity Funds, 2 Wasatch Funds, a micro-cap fund, one exchange traded fund, and 5 stocks. I am slowly moving my money over to stocks, trying to avoid to big a tax hit.
My mutual funds are:
Fidelity Select Energy Fund Current Value: $6,359.68 Cost: $5,000
Fidelity Select Health Care Current Value: $5,482.49 Cost: $5,000
Fidelity Low Priced Stock Fund Current Value: $39,612.18 Cost: $24,782
Fidelity Leveraged Company Fund Current Value: $60,250.56 Cost: $48,968.03
Fidelity International Discovery Fund Current Value: $14,283.44 Cost: $10,000
Wasatch Small Cap Growth Fund Current Value: $22,145.90 Cost: $13,675.33
Wasatch Core Growth Current Value: $49,465.91 Cost $25,235.98
Perrit Emerging Opportunities Current Value: $11,148.77 Cost: $10,0000
All stocks and the ETF bought within the last two weeks from redemptions from fund above.
ETF- Claymore-Sabrient Stealth Portfolio (STH) Bought 250 shares @26.65
Coach (COH) Bought 100 shares @38.41
News Corp (NWS) Bought 100 shares @21.70
Anheiser Busch (BUD) Bought 100 shares @47.60
Genentech (DNA) Bought 100 shares @83.76
Getty Images (GYI) Bought 80 shares @43.47
Cash: 381.69
Saturday, November 11, 2006
My new blog for portfolio analysis
This is my new blog to track my investments and post research that i find and hopefully learn a lot from people out there like myself.
Subscribe to:
Posts (Atom)
IV Calc
Warren Buffett Intrinsic Value Formula (?)
|
|


